





The full story
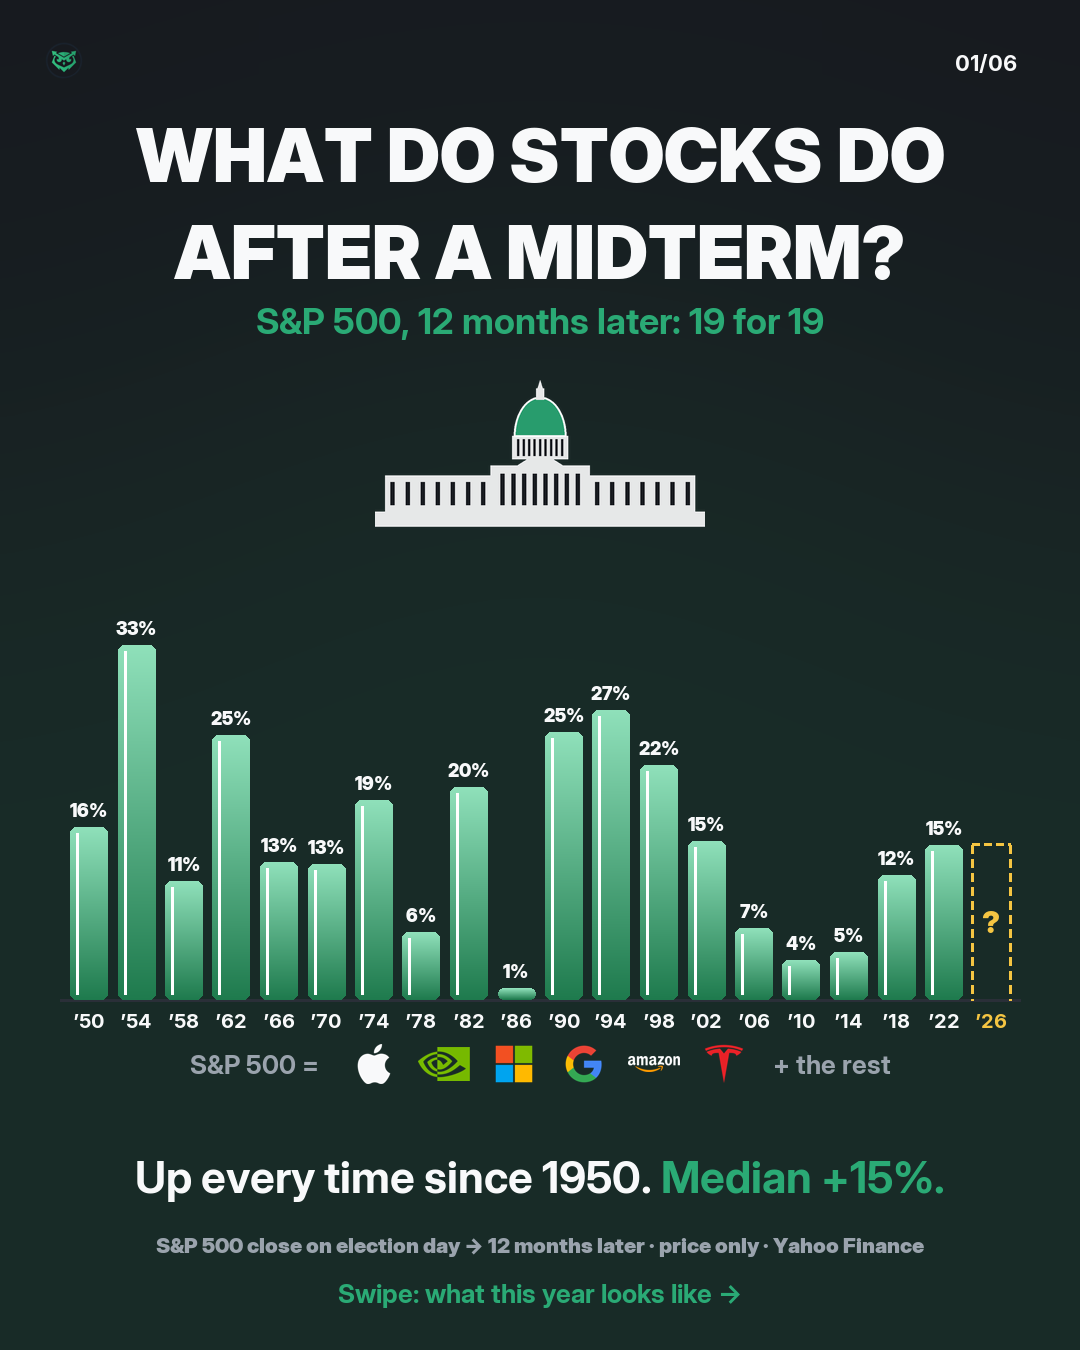
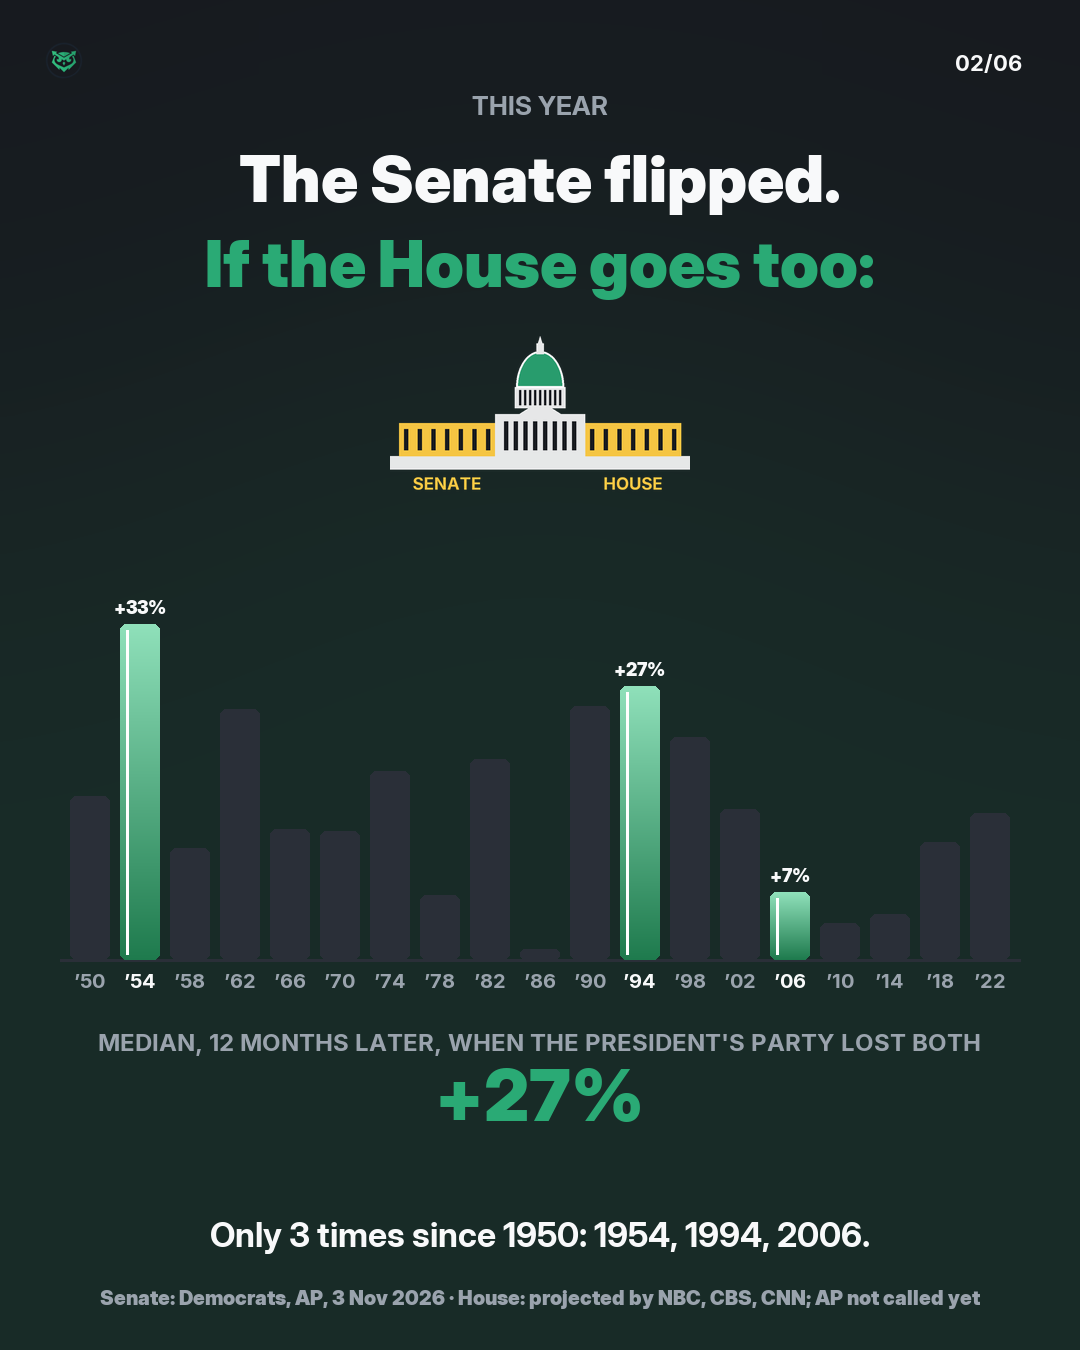
This year the Senate flipped, and the House is projected to flip too (the AP hasn't called it yet). Here is what history says, split by what happened to the president's party:
- Lost both houses (1954, 1994, 2006): +33%, +27%, +7%
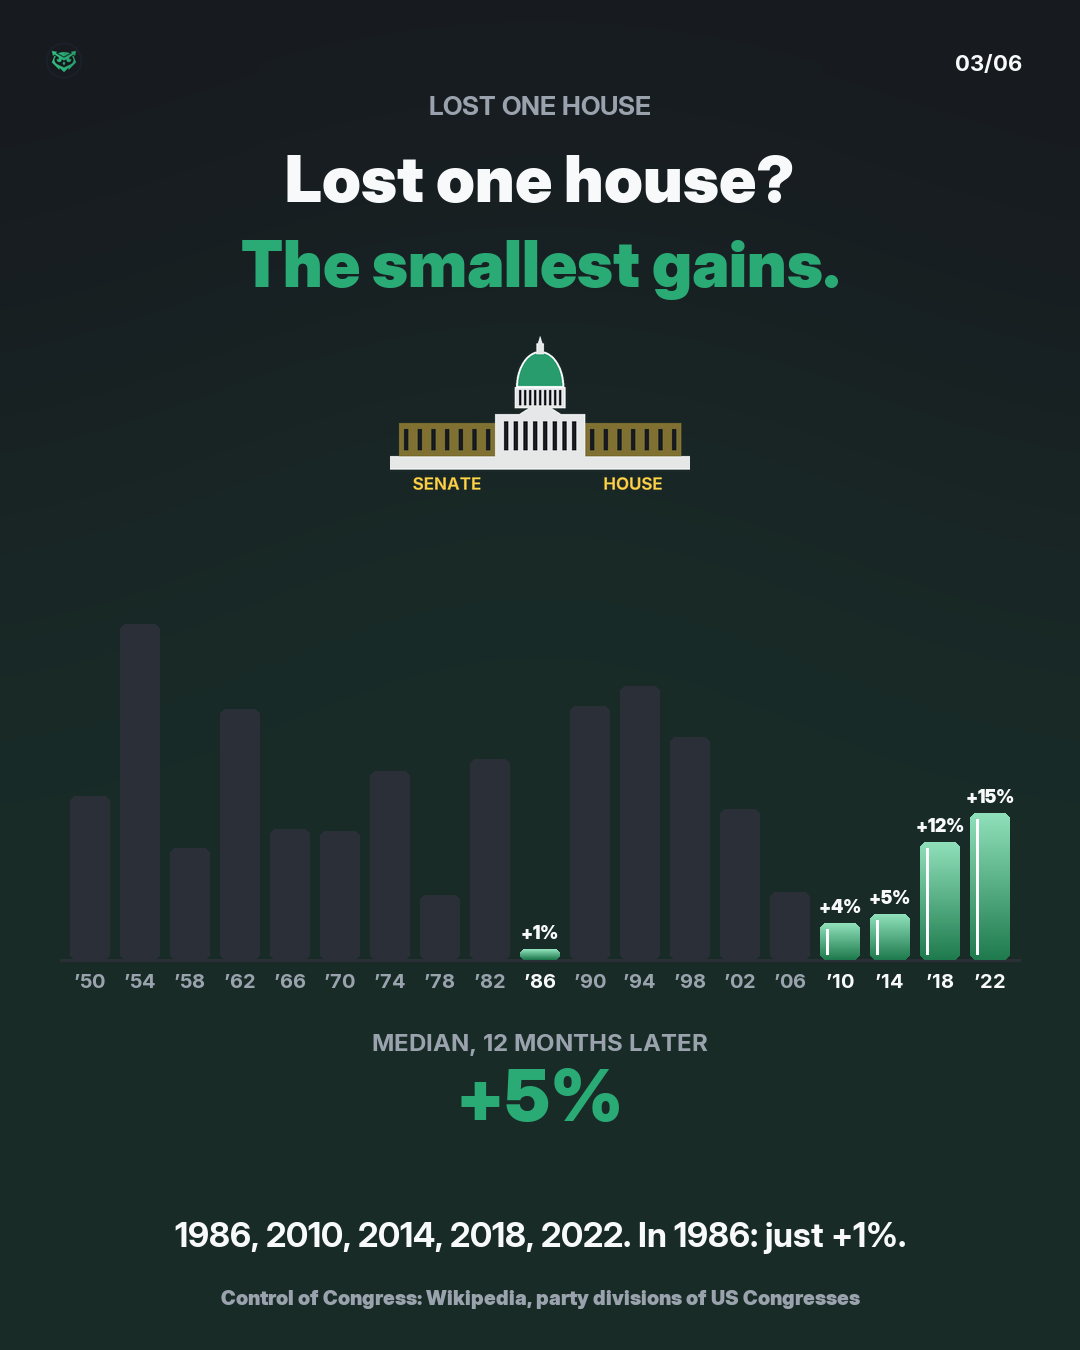
- Lost one house (1986, 2010, 2014, 2018, 2022): median +5%
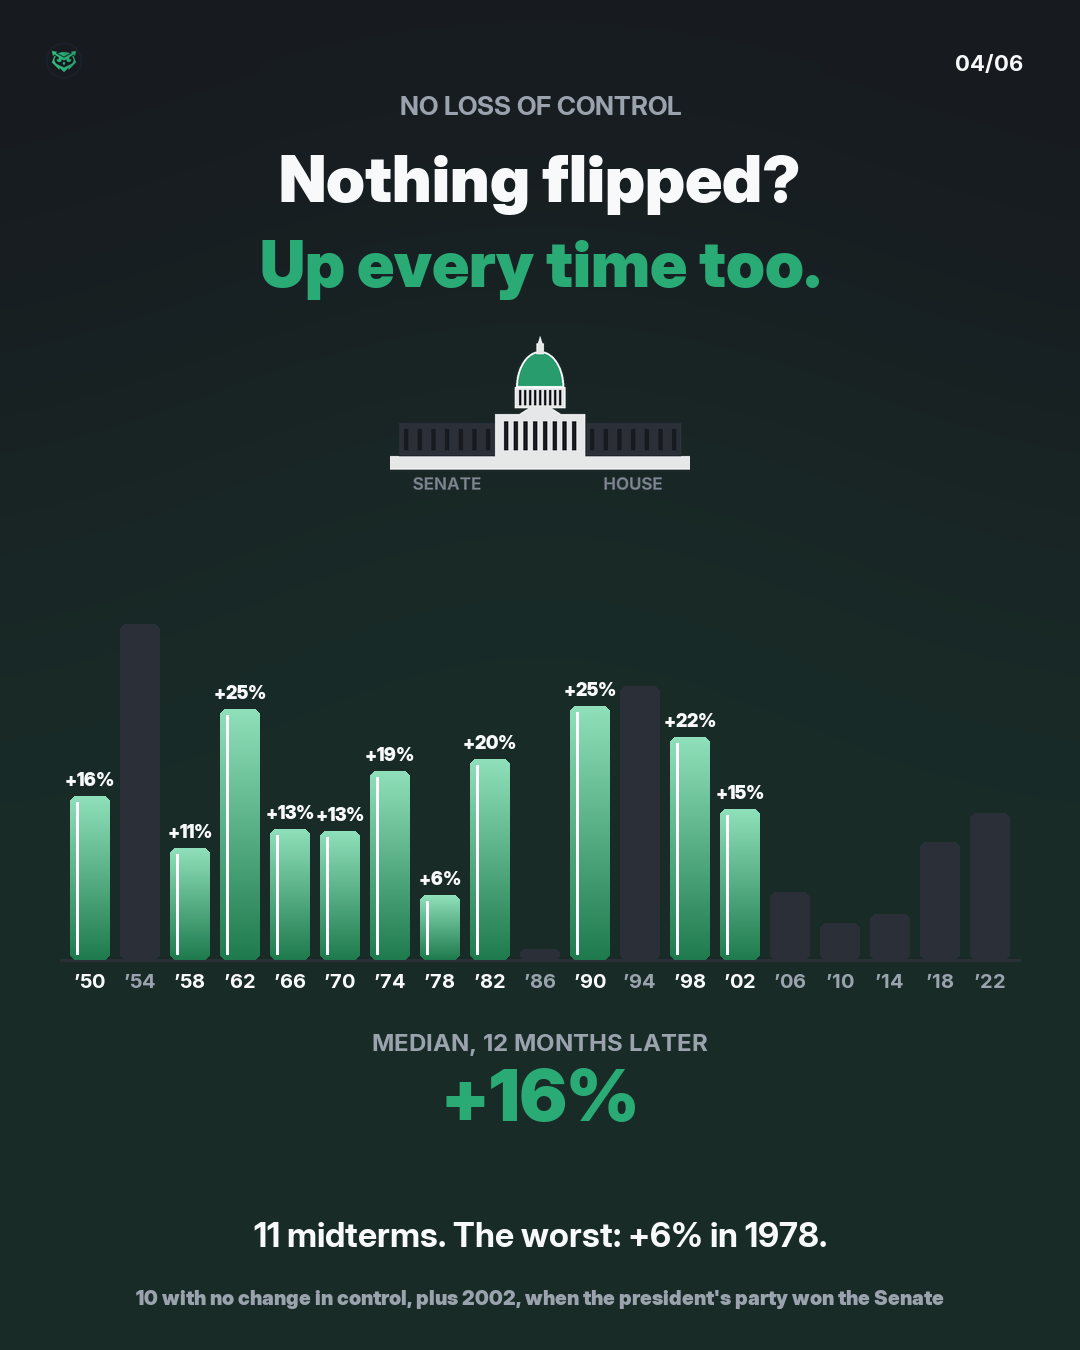
- Lost neither (11 midterms): median +16%
Measured on the S&P 500 from election day to 12 months later, price only.
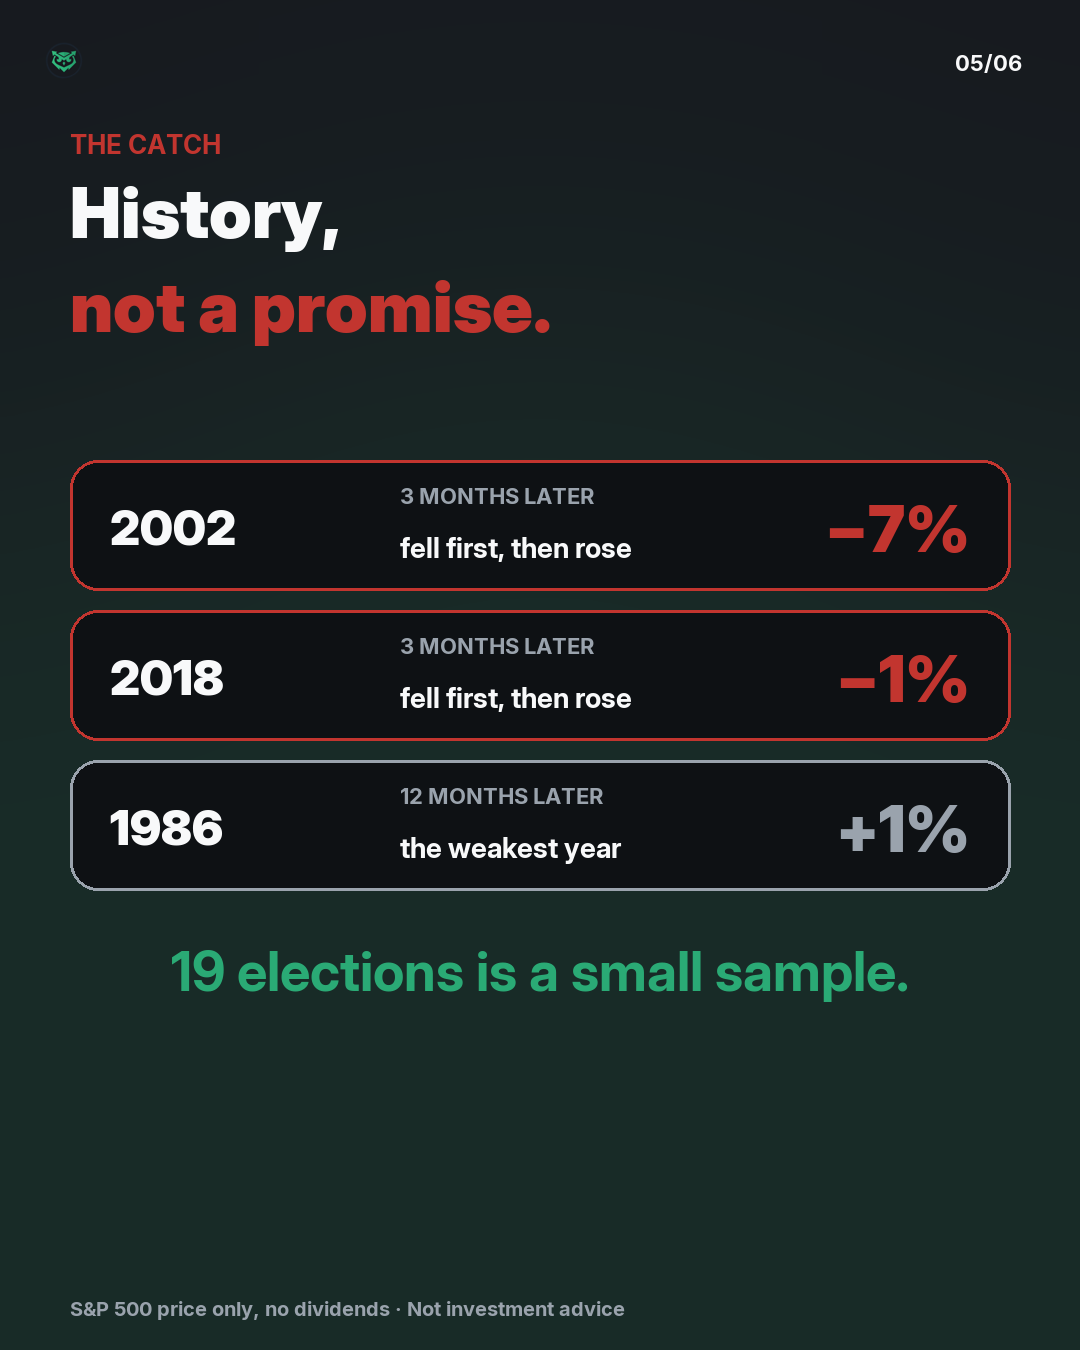
The catch: 19 elections is a small sample, and every year has its own story. In 2002 and 2018 stocks fell over the first 3 months before rising. And 2026 comes with its own problems, from prices to the war in Iran.
Which way do you think 2027 goes?
Not investment advice.
Want to see how this looks now?
Where the numbers come from
- 24/7 Wall St, 4 May 2026247wallst.com
- Reuters via Investing.cominvesting.com
- Wikipedia, Party divisions of United States Congressesen.wikipedia.org
- Yahoo liveyahoo.com