Big tech

Is big tech a bubble?

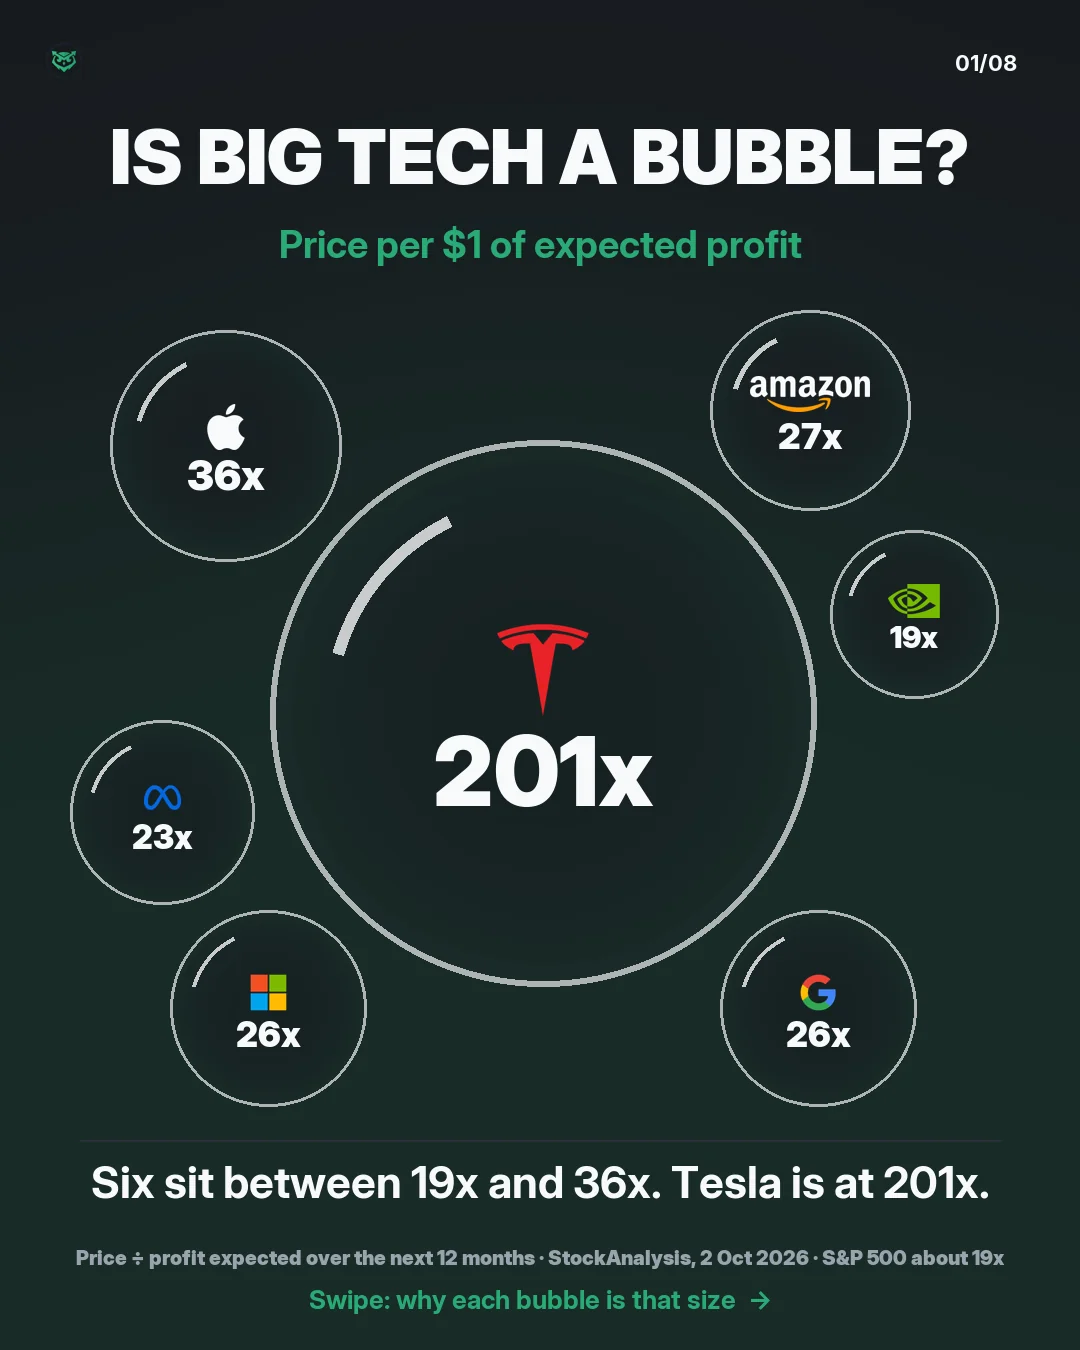
The Magnificent Seven trade at 16 to 158 times expected profit. Six are near the market. Tesla is eight times it.

Numbers as of 26 Sept 2026

The full story

  1. Seven bubbles sized by forward P/E, the price paid for each dollar of profit expected over the next 12 months: Tesla 201x, Apple 36x, Amazon 27x, Microsoft 26x, Alphabet 26x, Meta 23x, Nvidia 19x. Six sit between 19x and 36x; Tesla is at 201x. The S&P 500 is about 19x.
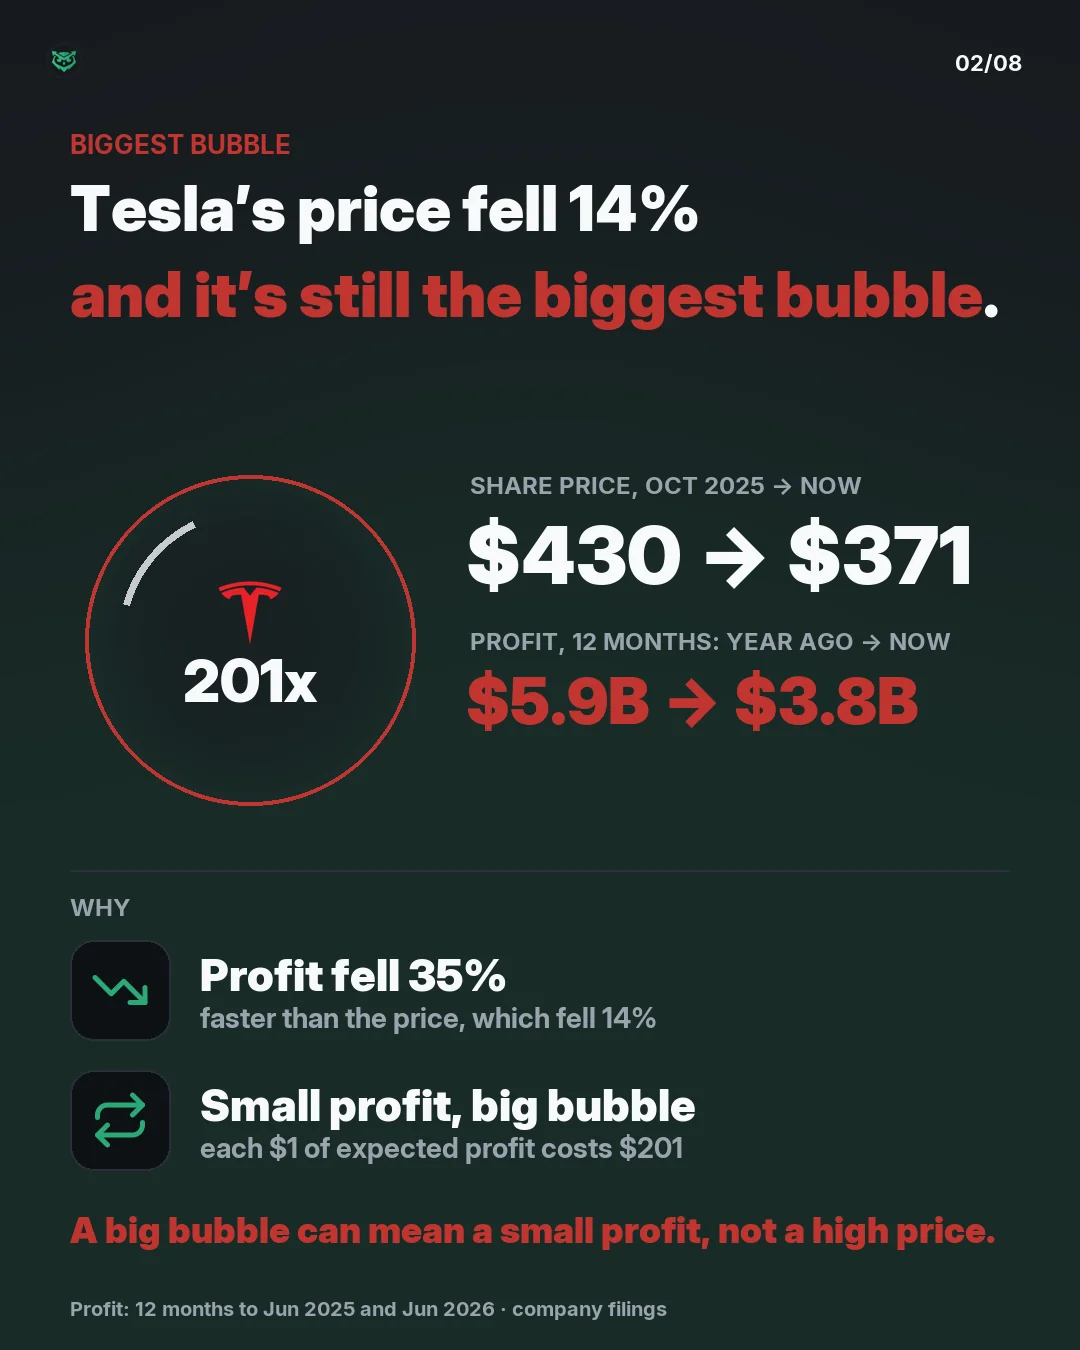
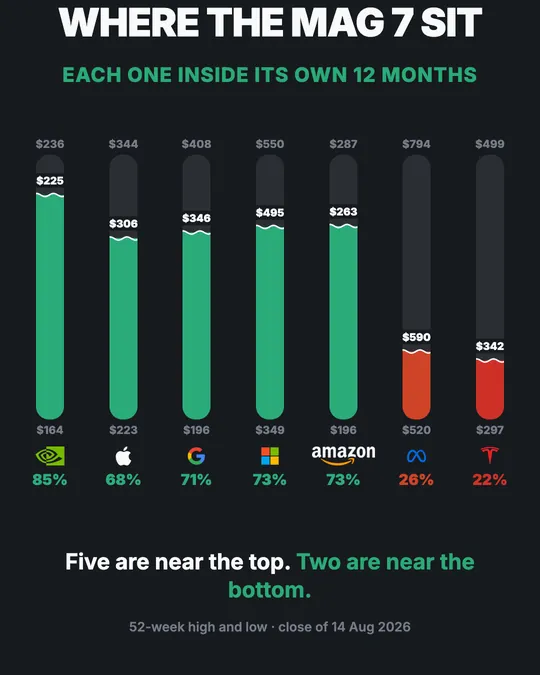
  2. Biggest bubble: Tesla, at 201 times expected profit. Its share price fell from 430 dollars in October 2025 to 371 dollars, down 14 percent. Profit over 12 months fell from 5.9 billion dollars to 3.8 billion, down 35 percent. A big bubble can mean a small profit, not a high price.
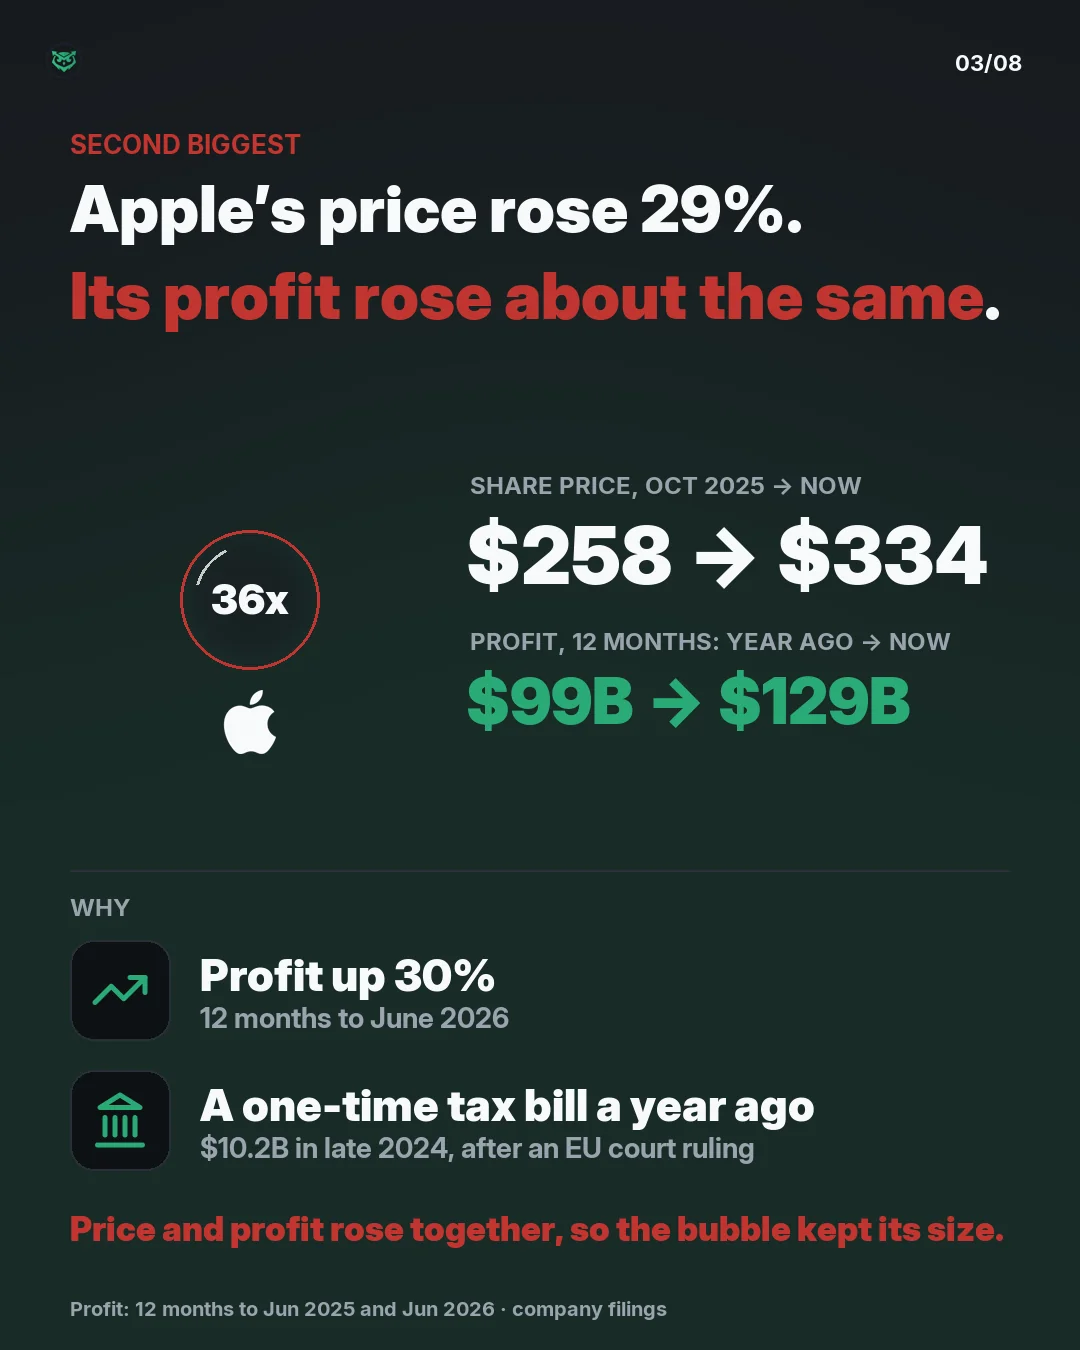
  3. Second biggest: Apple, at 36 times expected profit. Its share price rose from 258 dollars to 334, up 29 percent. Profit over 12 months rose from 99 billion dollars to 129 billion, up 30 percent; the earlier year included a one-time 10.2 billion dollar tax bill after an EU court ruling.
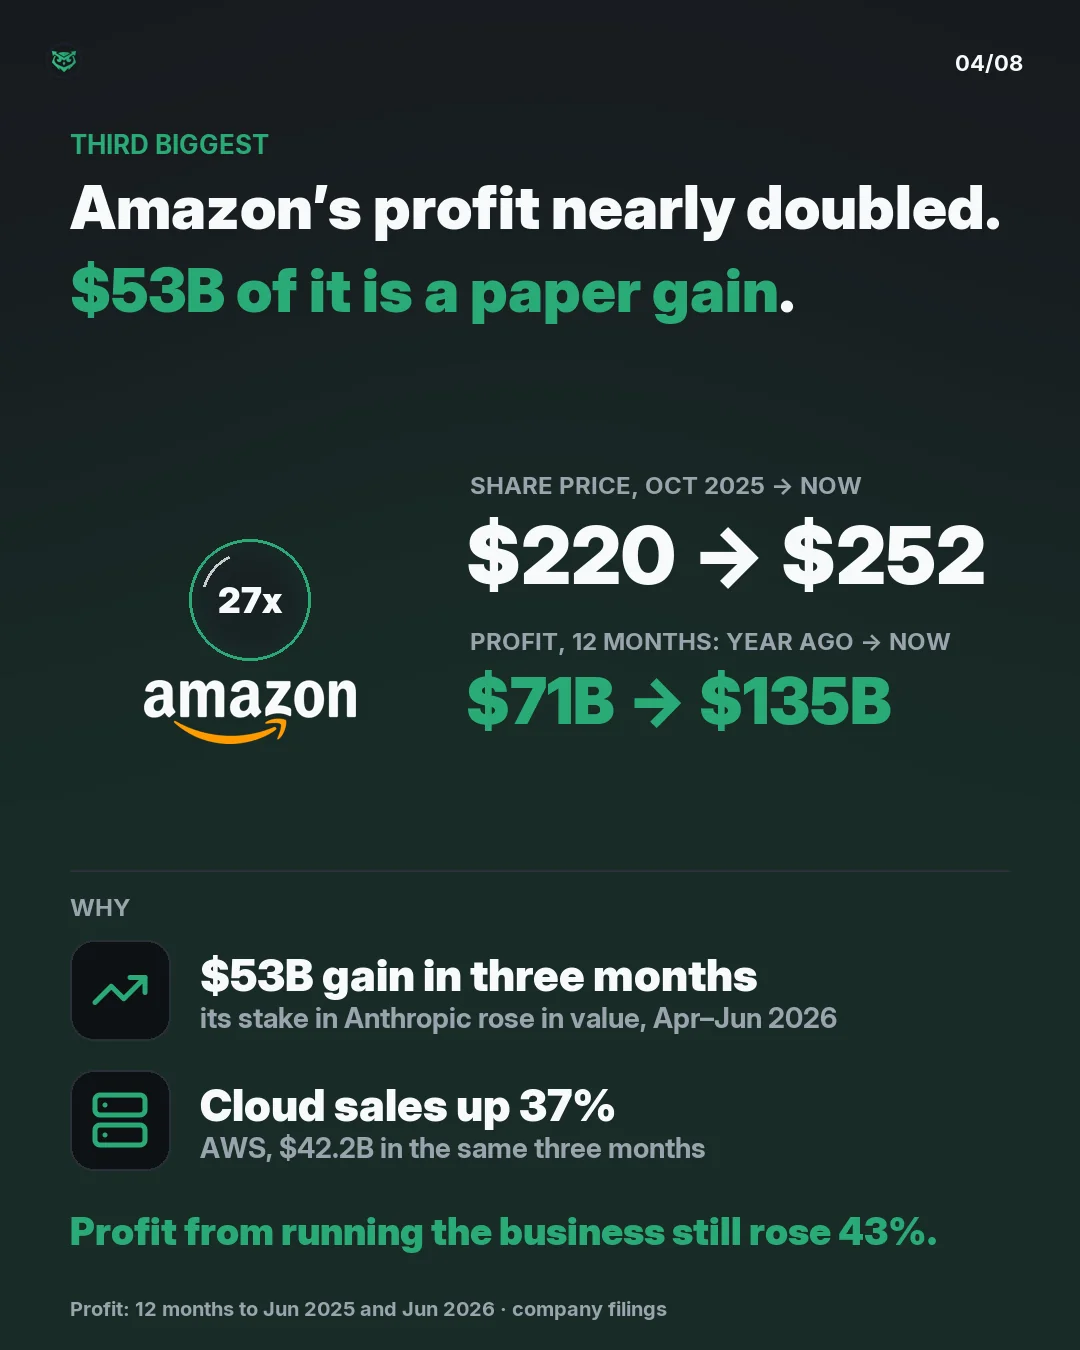
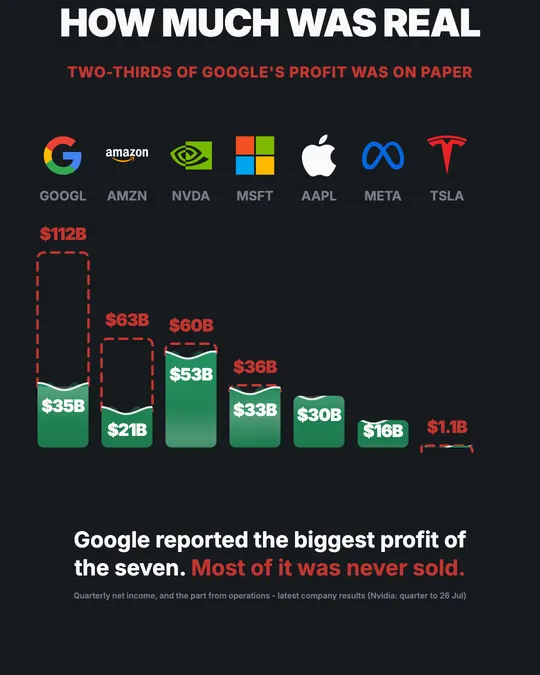
  4. Third biggest: Amazon, at 27 times expected profit. Its share price rose from 220 dollars to 252, up 15 percent. Profit over 12 months rose from 71 billion dollars to 135 billion, but 53 billion of that was a gain in the value of its Anthropic stake in April to June 2026. Cloud sales rose 37 percent
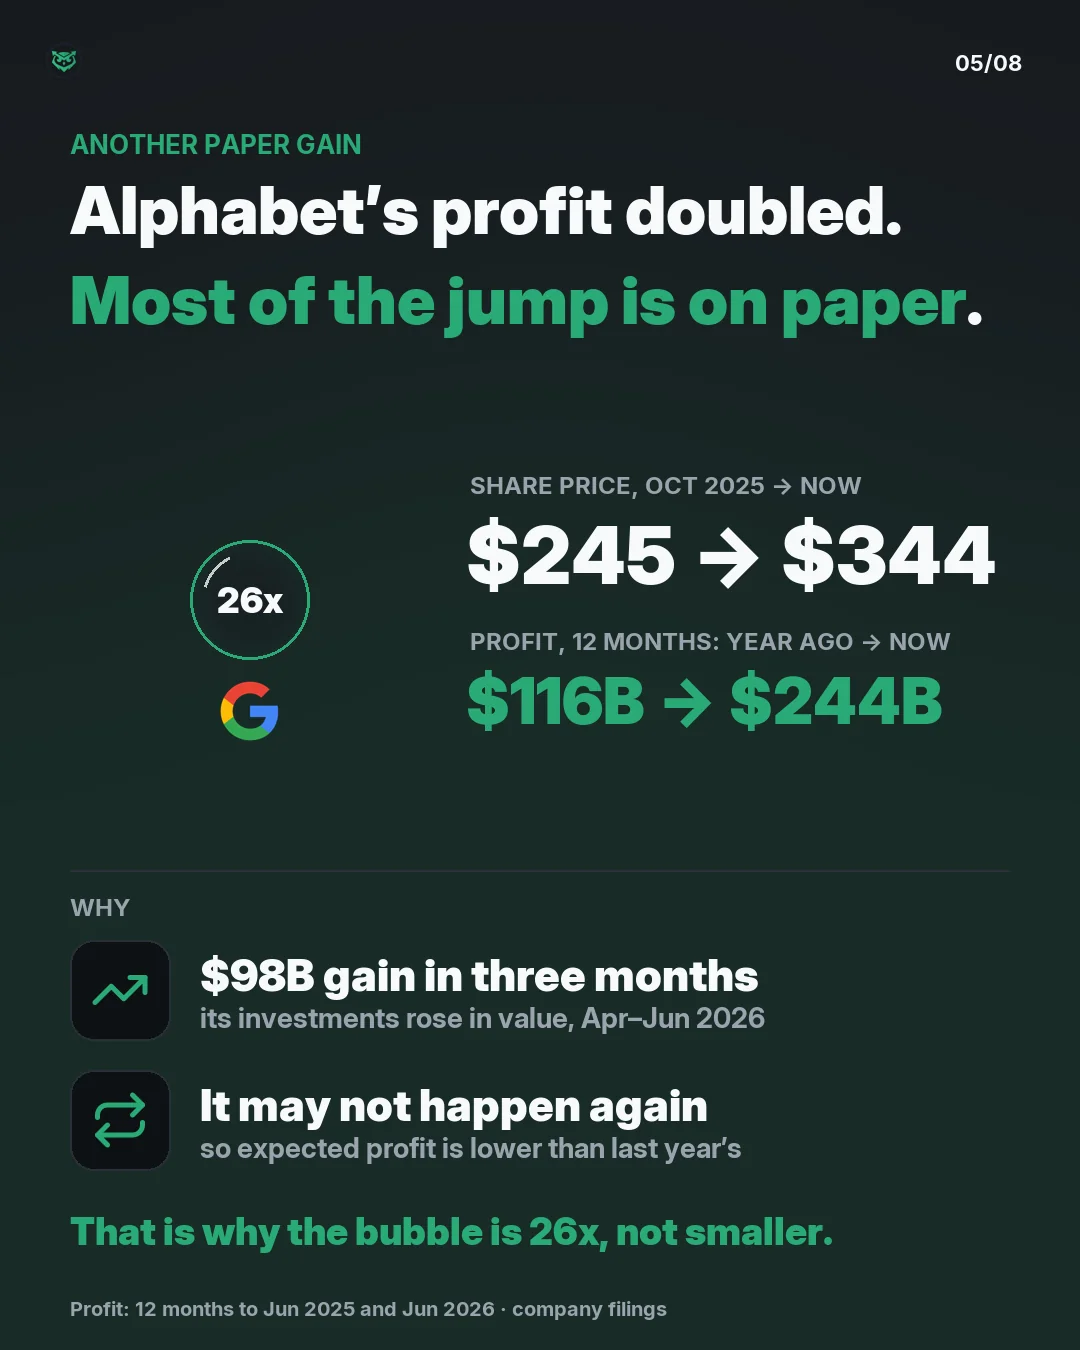
  5. Alphabet, at 26 times expected profit. Its share price rose from 245 dollars to 344, up 40 percent. Profit over 12 months rose from 116 billion dollars to 244 billion, but 98 billion of that was a gain in the value of its investments in April to June 2026, which may not repeat.
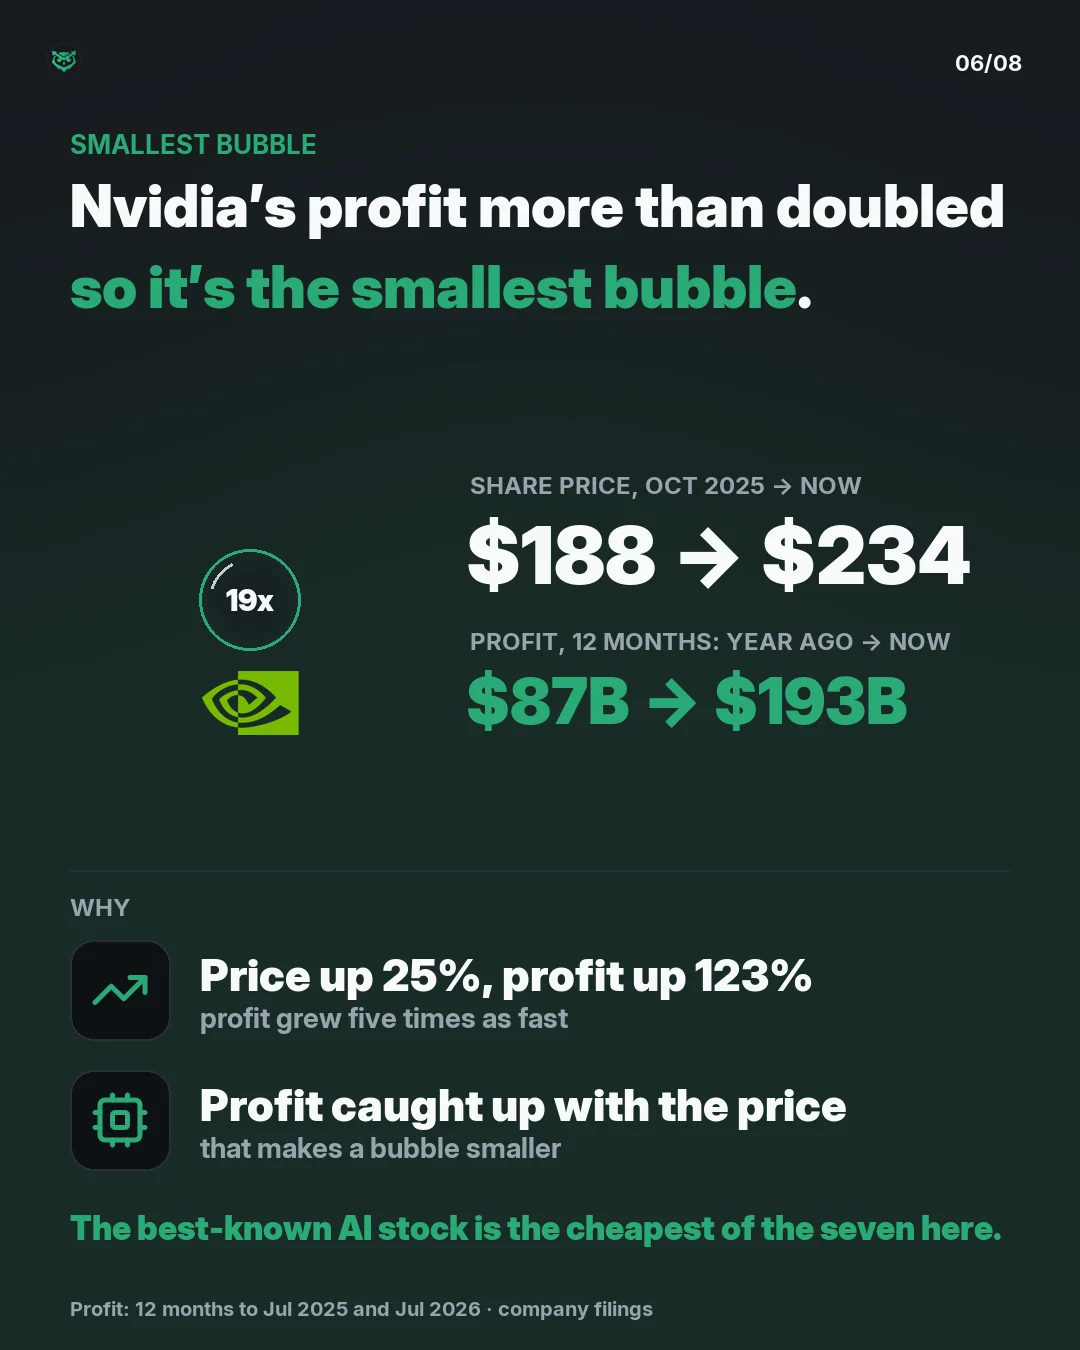
  6. Smallest bubble: Nvidia, at 19 times expected profit. Its share price rose from 188 dollars to 234, up 25 percent. Profit over 12 months rose from 87 billion dollars to 193 billion, up 123 percent. Profit caught up with the price.
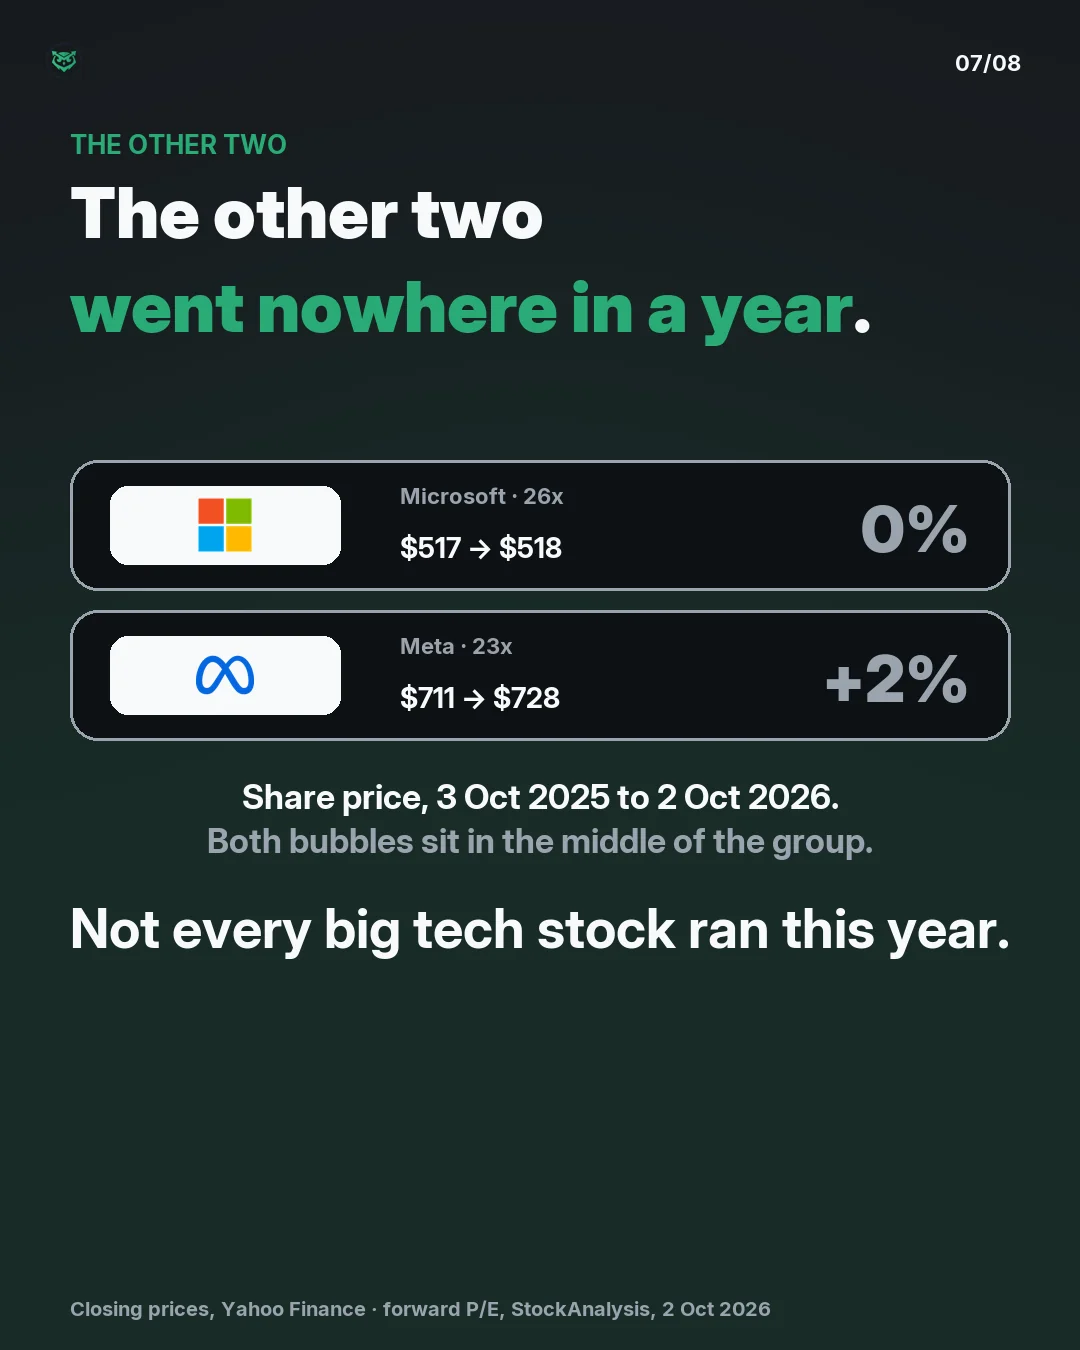
  7. The other two: Microsoft, 26 times expected profit, share price flat over a year at about 517 dollars. Meta, 23 times, up 2 percent from 711 to 728 dollars.
  8. Which one is the real bubble? A row of the Tesla, Apple and Alphabet logos, plus Other. Below: a high price, or a small profit? Follow Green Owl if you want more.

Forward P/E is the price divided by the profit analysts expect over the next year. The wider the bubble, the more you pay for each $1 of that profit. The S&P 500 sits at about 19x.

Meta 17x · Alphabet 16x · Amazon 24x · Microsoft 25x · Nvidia 25x · Apple 35x · Tesla 158x. Data late September 2026.

That reframes the usual line. The Magnificent Seven get called one bubble, but on this measure six of the seven sit between 16 and 35 times earnings - close to, at, or a little above the market. The outlier is Tesla, at more than eight times the index and four and a half times Apple.

Two reasons the picture can mislead. A forward P/E rests on forecasts, and forecasts are opinions - if the earnings do not arrive, the multiple was never real. And it ignores the balance sheet: two companies on the same multiple can carry very different debt and cash.

A high multiple is not a verdict either. It can be a small profit rather than a high price - Tesla's own earnings fell sharply, which is most of why its multiple is where it is. On trailing profit it is above 300x.


Want to see how this looks now?

When enough people ask, we re-check the numbers and redraw it.

Where the numbers come from

Show all 7 sources

Companies in this picture

More like this